 Saifullah Ahad
 LinkContourLive on Google Play
LinkContour: how to find dead spots in wifi, room by room
A dead spot is a place where your wifi gives up. You can find yours with nothing but a number and a notebook: read the signal where you actually sit, write it down, and compare the rooms. A university IT article and a U.S. government guide give the pieces.
The one scale to know
University of Michigan IT: a useful rule of thumb is that below −70 dBm you are unlikely to have good performance over Wi-Fi for bandwidth intensive tasks. The mark is drawn at −70 only to show that rule; the bar has no other values from the sources.
Five steps from “it feels slow in here” to a list of rooms
Each step says where it comes from. Neither source describes a walk through the house, so that part is marked as this page’s own suggestion.
-
1
This page’s own suggestion
List the places where you really use wifi
The desk, the sofa, the bed, the kitchen table, the back room. A dead spot only matters where somebody sits. Write each place on its own line in a notebook.
-
2
University of Michigan IT
Read the signal number at one place
The Michigan knowledge-base article defines the number:
“Received Signal Strength Indicator (RSSI) is an estimated measurement of how well a device can hear, detect and receive signals from any wireless access point or Wi-Fi router.”
On a Mac, it says to Option-click the Wi-Fi menu, and the RSSI of your current connection is shown. To compare every network in range, it says to choose “Open Wireless Diagnostics”, then Window, then Scan. On Linux, the command
iwconfigshows “Signal level”. It names a separate program for Windows. The article is about computers and says nothing about phones. -
3
University of Michigan IT
Know which way is good
The same article says “An RSSI closer to 0 is stronger, and closer to −100 is weaker.” It adds: “For best performance, you want your RSSI to be as high as possible. A useful rule of thumb is that if the RSSI is less than −70 dBm, you are unlikely to have good performance over Wi-Fi for bandwidth intensive tasks.” That one line is the only cutoff it gives.
-
4
This page’s own suggestion
Repeat at every place and keep a log
Read the number again at each place on your list, with the same device held the same way, and write it next to the name. Mark any place under the −70 rule of thumb. Here is the shape of a log. The numbers are invented to show the layout, not measurements of any home.
Example log, invented numbers Place Reading (dBm) Under −70? Desk −52 No Sofa −61 No Kitchen table −68 No, close Back bedroom −74 Yes, a dead spot by this rule One reading is a snapshot. LinkContour’s own Guide says “do not treat one sample as a guarantee”, and the same goes for a notebook: read twice at the places that matter.
-
5
Michigan IT and the FCC
Try the simple moves, then read again
Michigan says the simplest solutions are to “move your computer as close as possible to the Wi-Fi router” or to “connect with an Ethernet cable and bypass Wi-Fi altogether.” The FCC’s home network tips add four points:
- “try to place your router in a central location.”
- “A Wi-Fi range extender or mesh network routers can also improve the Wi-Fi signal strength throughout your home.”
- 2.4 GHz connections “generally offer broader coverage, but they process data less quickly than 5 GHz connections”, and a 5 GHz signal “covers a shorter range”.
- If you see a list of other Wi-Fi networks in your router’s Wi-Fi settings, “your performance could be impacted by those neighboring networks.”
After any change, read every place on the list again, the same way. Comparing the two columns is the only way to know whether the move helped. Neither source says a move always will.
Both sources are general advice. The FCC guide is the 2020 pandemic-era version, read from its PDF; I could not fetch the FCC’s newer web page. Michigan’s article does not mention walls, and neither source does, so this page says nothing about what walls or materials do to a signal.
University of Michigan, College of LSA
“Determining your Wi-Fi signal strength (RSSI)”, IT knowledge base article 1644. Used for steps 2, 3 and 5. I also read its linked article “Improving your home Wi-Fi network”, which mostly repeats the cable advice and points to outside articles.
U.S. Federal Communications Commission
“Home Network Tips for the Coronavirus Pandemic”, a consumer guide posted 2020-03-26, three pages read in full. Used for step 5.
LinkContour does the logging on a floor plan.
LinkContour is an Android app for mapping Wi-Fi signal across a room. Instead of a notebook, you make a survey of your space, tap the places where you stand, and it saves one reading for each, then colors the plan from them. It reads the signal of a network you choose; it never connects to or changes any network.
- 1Create first survey: a name, Width (m), Height (m), and optionally Import floor plan
- 2Tap the plan: POINT ARMED
- 3Stand there and press Measure here
- 4Read CONTOURS, CHANNELS and COMPARE
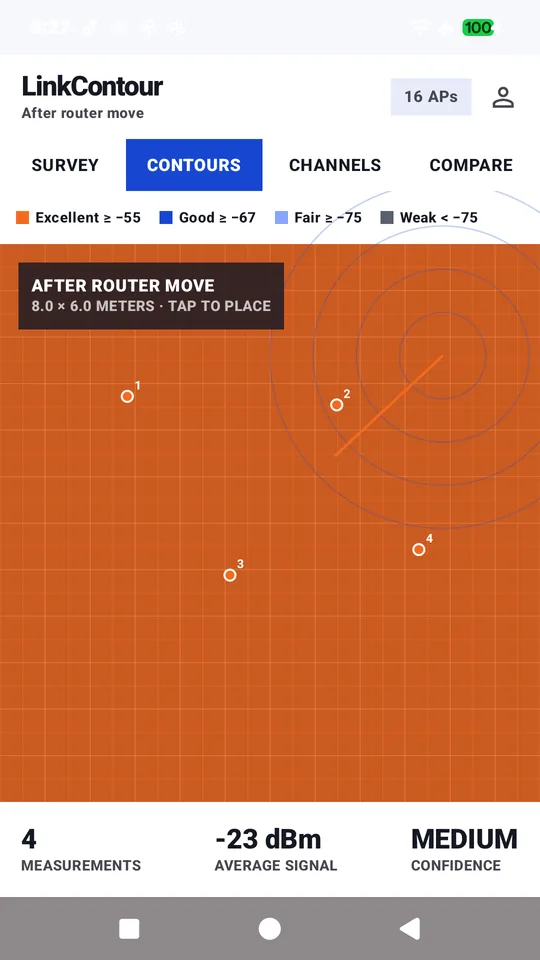
Contours
After you save points on the SURVEY tab, CONTOURS colors every cell of the plan from them, in four bands: Excellent ≥ −55, Good ≥ −67, Fair ≥ −75 and Weak < −75. Below the map it shows MEASUREMENTS, AVERAGE SIGNAL and CONFIDENCE. The confidence label only counts points: LOW under 3, MEDIUM from 3, HIGH from 8.
The Contours tab of the app’s example survey, After router move: four points on an 8.0 by 6.0 meter plan, 4 measurements, −23 dBm average, medium confidence. The whole map is the color of the top band, so this example has no weak area.
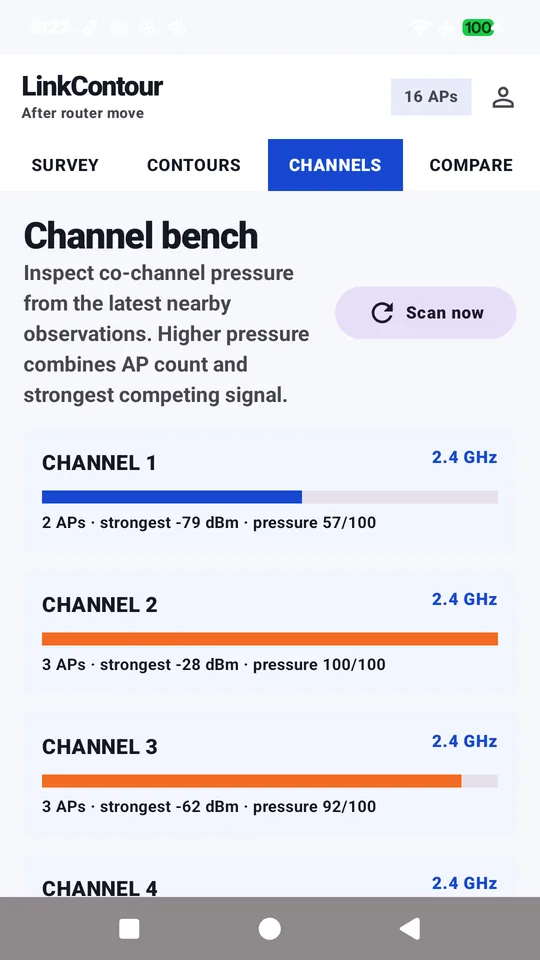
Channels
Channel bench lists the channels the phone saw in its latest scan, with the number of access points on each, the strongest signal and a pressure score out of 100. The score grows with the number of access points and with the strongest signal among them, and stops at 100. The app’s own note says it is local evidence, not a router instruction, and to confirm across several positions and times before changing a channel.
The Channels tab of the example survey: channels 1, 2 and 3 on 2.4 GHz with pressure 57, 100 and 92 out of 100. Channel 4 is cut off at the bottom.
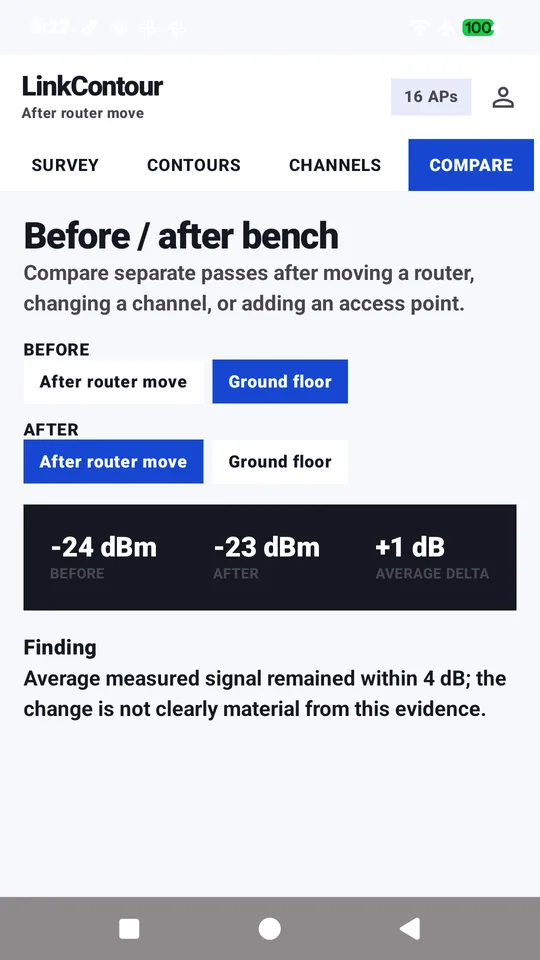
Compare
This is step 5 with numbers. Make a second survey of the same space after a change, with points in similar places, and COMPARE shows BEFORE, AFTER and AVERAGE DELTA, the averages of each survey and the difference. A difference under 4 dB is called not clearly material; from 4 dB it says improved or declined by about that many dB.
The Compare tab of the example survey: Ground floor as Before at −24 dBm, After router move as After at −23 dBm, a change of +1 dB, and the finding that the change is not clearly material.
What you get
- One reading saved for each point you tap, kept with its place on your plan.
- A color map between your points, a count-based confidence label and the channel list.
- Before and after surveys side by side.
- Under LIBRARY, a CSV or PDF of a survey, saved to a place you pick.
Where it stops
- It does not measure speed, and it does not know where the walls are.
- It takes one scan per point and does not check how old that scan is.
- It colors the whole plan, including places far from every point, and does not mark them as not measured. Place points across the space.
- It does not change router settings, and it is not a professional radio survey tool.
- Android asks for precise-location permission before an app may read Wi-Fi scan results. The app says it does not read GPS.
What it keeps, and where
Survey names, room sizes, the place of each point, network names and access-point addresses, signal, channel and time stay in the app’s private storage on your phone. The privacy policy says they are not sent to the developer or any third party, and the app has no internet permission. A floor-plan image stays where you chose it; the app keeps Android’s reference to it. A CSV or PDF leaves the app only when you pick a place to save it. Android backup is off for the app. Records stay until you delete a point or survey, clear the app’s storage or uninstall it. Read the privacy policy.
What I did not check
For this story I read the store listing, the README, the product brief, the Play answers, the privacy policy, the code, the screen texts and the app’s one test file, which has three tests, of channel numbers and of how values are blended between points, and I looked at the store pictures. I did not run the app or those tests, I did not compare its readings with any other tool, and the records show no phone run for it. A fourth store picture shows the names of nearby networks, so I left it out.
View LinkContour on Google PlayKnow a room where the wifi gives up?
Send them the five steps. The notebook comes first.